Consumers
This section contains examples of how to access Ecoengine resources with third party packages and desktop applications.
rOpenSci
Karthik Ram of the rOpenSci project created a wrapper around the Ecoengine that allows for direct access to our resources within an R session. Find a tutorial and detailed documentation here or read this blog post.
Import Data into Desktop and Third Party Web Applications
The API is not just a powerful tool for developers building web applications, it also provides data access in a wide range of contexts, basically within any application that can communicate over the https protocol. The following tutorials will help non-developers to make use of the vast data stored in our API.
Preparing URLs
- Use this documentation and the browse-able API to determine the URL that represents the resource to add, e.g. /api/observations/?genus=puma. This URL is not quite ready, a couple more things have to be done since this will only return the first 10 records in a format many applications, e.g. QGIS, cannot yet digest.
- Add the
page_sizeparameter to get more results. If you open the URL below you will get a count of returned records, for the puma example its ~ 260 (which changes as new data sets come available). For smaller numbers of records (up to ~ 1000) you can just increase the page_size accordingly. /api/observations/?genus=puma&page_size=262. - For larger returns you might need to send several requests using the
pageparameter. E.g. /api/observations/?genus=puma&page_size=100&page=1 and /api/observations/?genus=puma&page_size=100&page=2 etc. - Next you need to pick the correct return format by adding the
formatparameter. Using the example from 2 above, it would be /api/observations/?genus=puma&page_size=262&format=geojson. - Modify the field selection parameters (
fields,exclude,extra) to get additional data, or to reduce the amount of data returned by the API.
Warning
Not all applications can deal with empty geometries in GeoJSON, setting georeferenced=True might
be necessary to load the data.
Microsoft Excel, LibreOffice Calc, and Similar
If you request ?format=csv the API will return a CSV file that will be
– depending on your system – most likely trigger a download window to open. Such a
comma-delimited CSV file can be opened within most spreadsheet applications. In many cases
this will be as easy as choosing the ‘Open with ...’ option in the download menu.
A special case – preparing data for MaxEnt
Coming soon.
QGIS
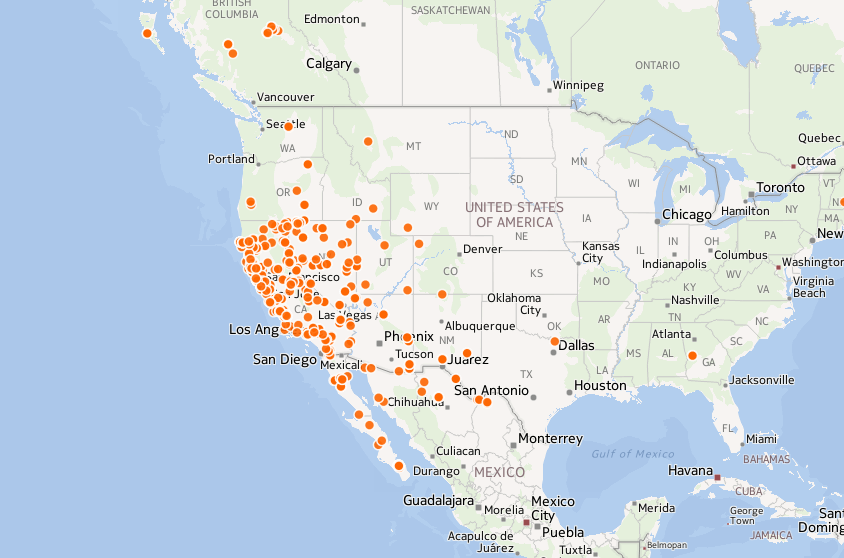
QGIS is a very powerful alternative to ArcGIS and provides a powerful GIS desktop framework. GeoJSON data streams (from the Ecoengine) can be easily added as layers. Here is a short example how to add all occurrences of puma to your map using QGIS 2.0.1.
Warning
?georeferenced=True is required
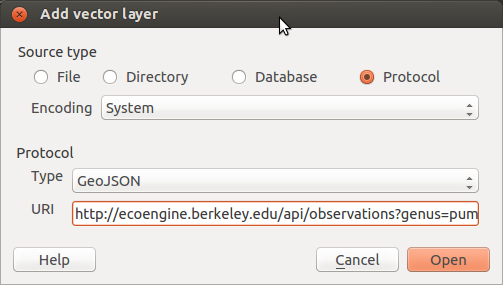
The following steps start from the URL generated above (https://ecoengine.berkeley.edu/api/observations/?genus=puma&page_size=262&format=geojson&georeferenced=True):
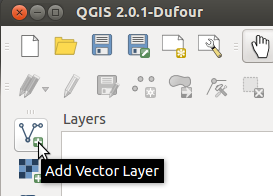
- Open the “Add Vector Layer” dialogue
- Select ‘Protocol’ of type ‘GeoJSON’, copy URL, and click open:
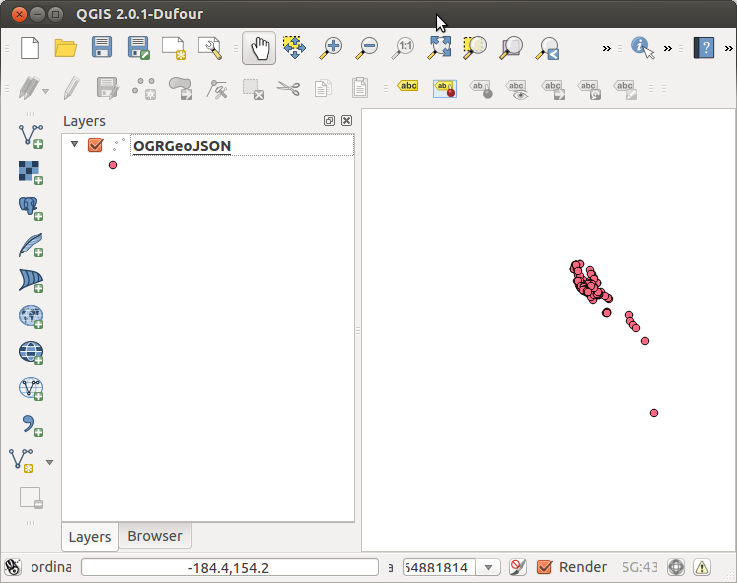
- The result will be similar to this:
Note
This will not result in a live connector but in a local copy of the data that can be saved in different formats. For updates, repeat the process.
Note
The projection information provided by the srs= parameter will carry over to QGIS.
If no information is provided, the API will return coordinates in WGS84 latitude and longitudes
(EPSG:4326). Use e.g. ?srs=3310 to modify.
ArcGIS
The challenge for users of ArcGIS is that there is no GeoJSON import filter implemented if the data interoperability extension is not installed and paid for. However, there are a few ways to import the data below.
Quick and Dirty
The quickest “one off” fix is to download the data in CSV format e.g. /api/observations/?genus=puma&page_size=262&format=csv.
The resulting CSV will contain the x and y coordinates in two fields geojson.coordinates.0
and geojson.coordinates.1, which need to be assigned while importing the CSV file in ArcMap.
Additionally, manually set the geographic reference system with the ‘Define Projection’ tool (which is DIFFERENT from the Project tool). Set to WGS84 if not requested otherwise.
Warning
Works only for point data (e.g. occurrences and photos) but not for features.
See also http://support.esri.com/en/knowledgebase/techarticles/detail/27589.
More Elegant, Still Without Data Interoperability Extension
A second strategy – especially suitable for projects that work with scripts – is to use Pythons JSON and urllib2 libraries to map the API fields into an ArcMap feature class. The following code example can be used as a starting point to expand on.
The following code can be run in a ArcMap Python console (swap out output path). It will add the layer to the map.
import json
import urllib2
import arcpy

# Set up environment.
arcpy.env.outputCoordinateSystem = arcpy.SpatialReference(4326)
arcpy.env.overwriteOutput = True
arcpy.env.workspace = 'C:/pathtoworkspace'

# Make the API request.
response = urllib2.urlopen(
    'https://ecoengine.berkeley.edu/api/observations/'
    '?genus=lynx&format=geojson&georeferenced=True&page_size=100')

# Create a feature class from the response.
data = json.load(response)
points = [arcpy.AsShape(feature['geometry'], False)
          for feature in data['features']]
arcpy.CopyFeatures_management(points, 'lynx.shp')
Note
The example covers only point data and not the generation of attributes. However the example can be easily expanded.
Using data interoperability extension
Coming soon.
CartoDB
CartoDB is a web service that allows for the fast generation of maps from uploaded data. In addition, it will provide a RESTful API which wraps spatial SQL queries on the data. Users are allowed up to five public tables, 5Mbytes of storage, and 10000 monthly map views within a free account to evaluate the utility of CartoDB. For additional functionality you need to subscribe to one of their payment plans.
Steps to get Ecoengine data into a CartoDB table
- Create an account and log in.
- Go to “Your Dashboard”. Link will be on top of page.
- If it is your first table, there will be a guide to create a table. Otherwise you will find an “New Table” link.
- In both cases you will get to a window like below. Add your URL in the form field. In the example it is https://ecoengine.berkeley.edu/api/observations/?genus=lynx&format=geojson&page_size=700

Warning
Both the https:// part of the URL as well as the query parameter format=geojson are required for
successful import.
- After creating the table you can see your data instantly on a map by clicking the “Map View” tab.